BrandBits Logo

Flipbook Analytics to Improve Content

See exactly how people read your flipbooks - which pages hold attention, where they drop off, and how long they stay - then use that to make your next version convert better.
  • Read page-by-page flipbook statistics, not just total views
  • Spot the exact page where readers lose interest
  • Find your most-read content so you can double down on it
  • Update your flipbook with improved content in one click
Flipbook Analytics to Improve Content - read page-by-page statistics, find drop-off, and improve your content

Publishing a flipbook is the easy part. The real wins come after - when you can see how people actually read it. Did they make it past the cover? Which page made them leave? What did they spend the most time on?

Every BrandBits flipbook reports detailed statistics for each individual page, so you are never guessing. This guide shows you how to read those numbers and turn them into a better, higher-converting flipbook - all on one platform for a single monthly fee.

Per-page flipbook statistics table showing visitors, reads, average time and drop-off rate
Page Statistics

Go beyond views - see every page

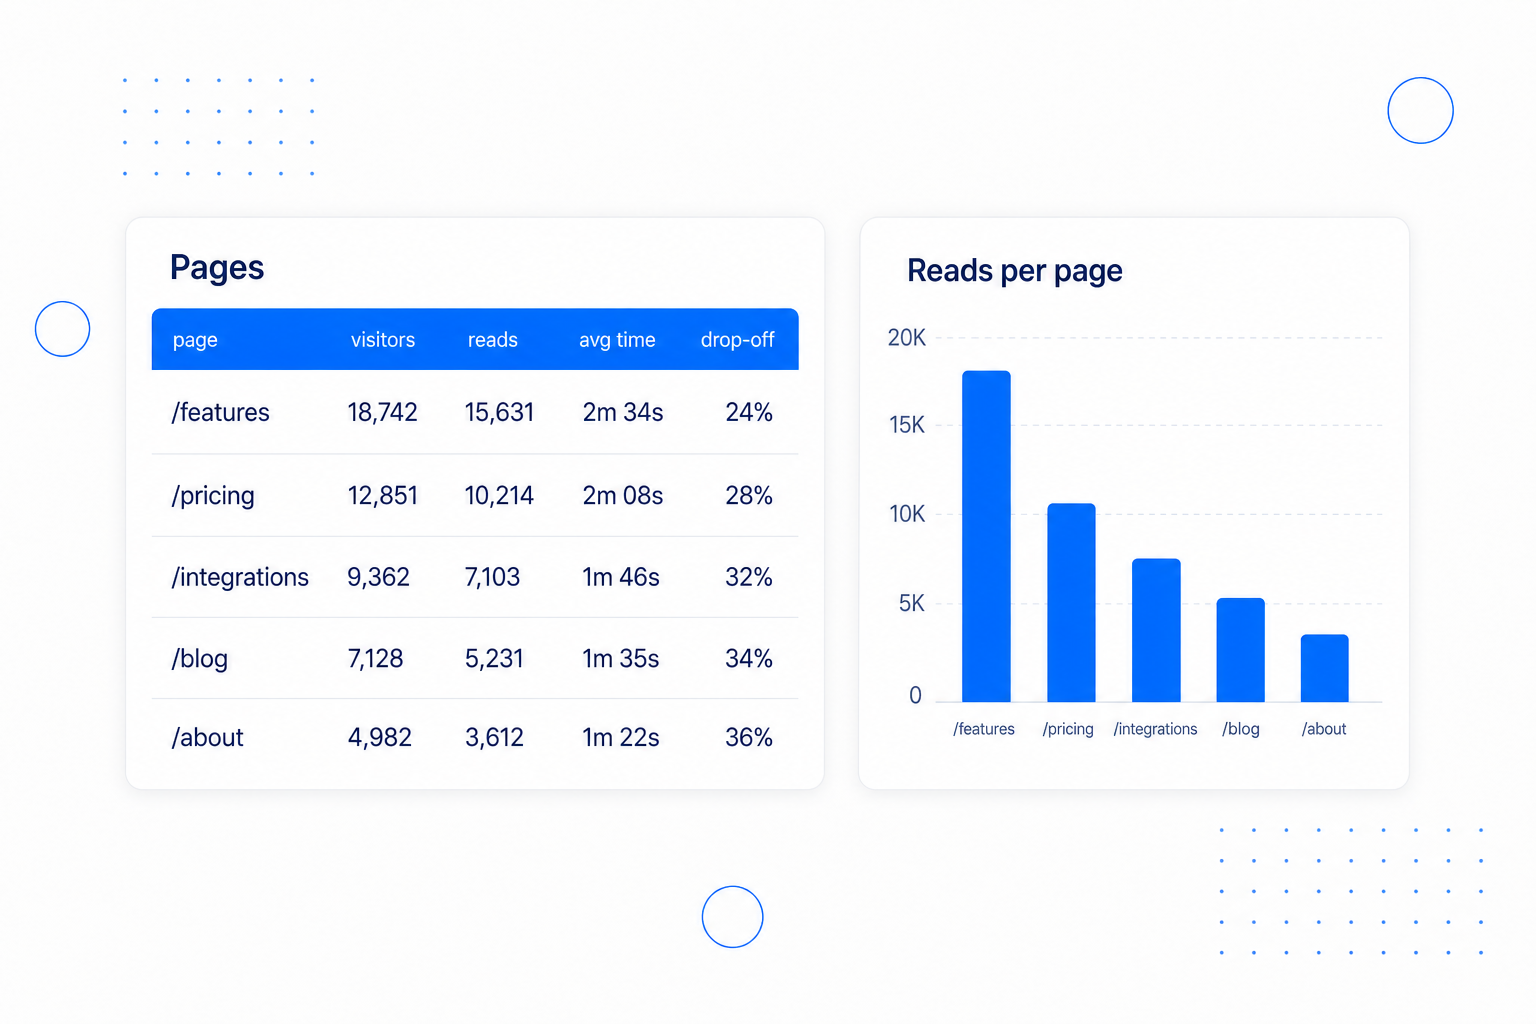
Total views tell you a flipbook was opened. They don't tell you what people actually read. Flipbook statistics break performance down page by page, so you can see exactly how far readers get and which spreads do the heavy lifting.

  • See visitors, reads and average time on every single page.
  • Identify the pages that hold attention - and the ones people skip.
  • Compare spreads to learn what layout and content works.
  • Switch between 7, 30 and 90 days or all-time to spot trends.
Visitors over time line chart and a total reading time card
Engagement

Measure attention, not just clicks

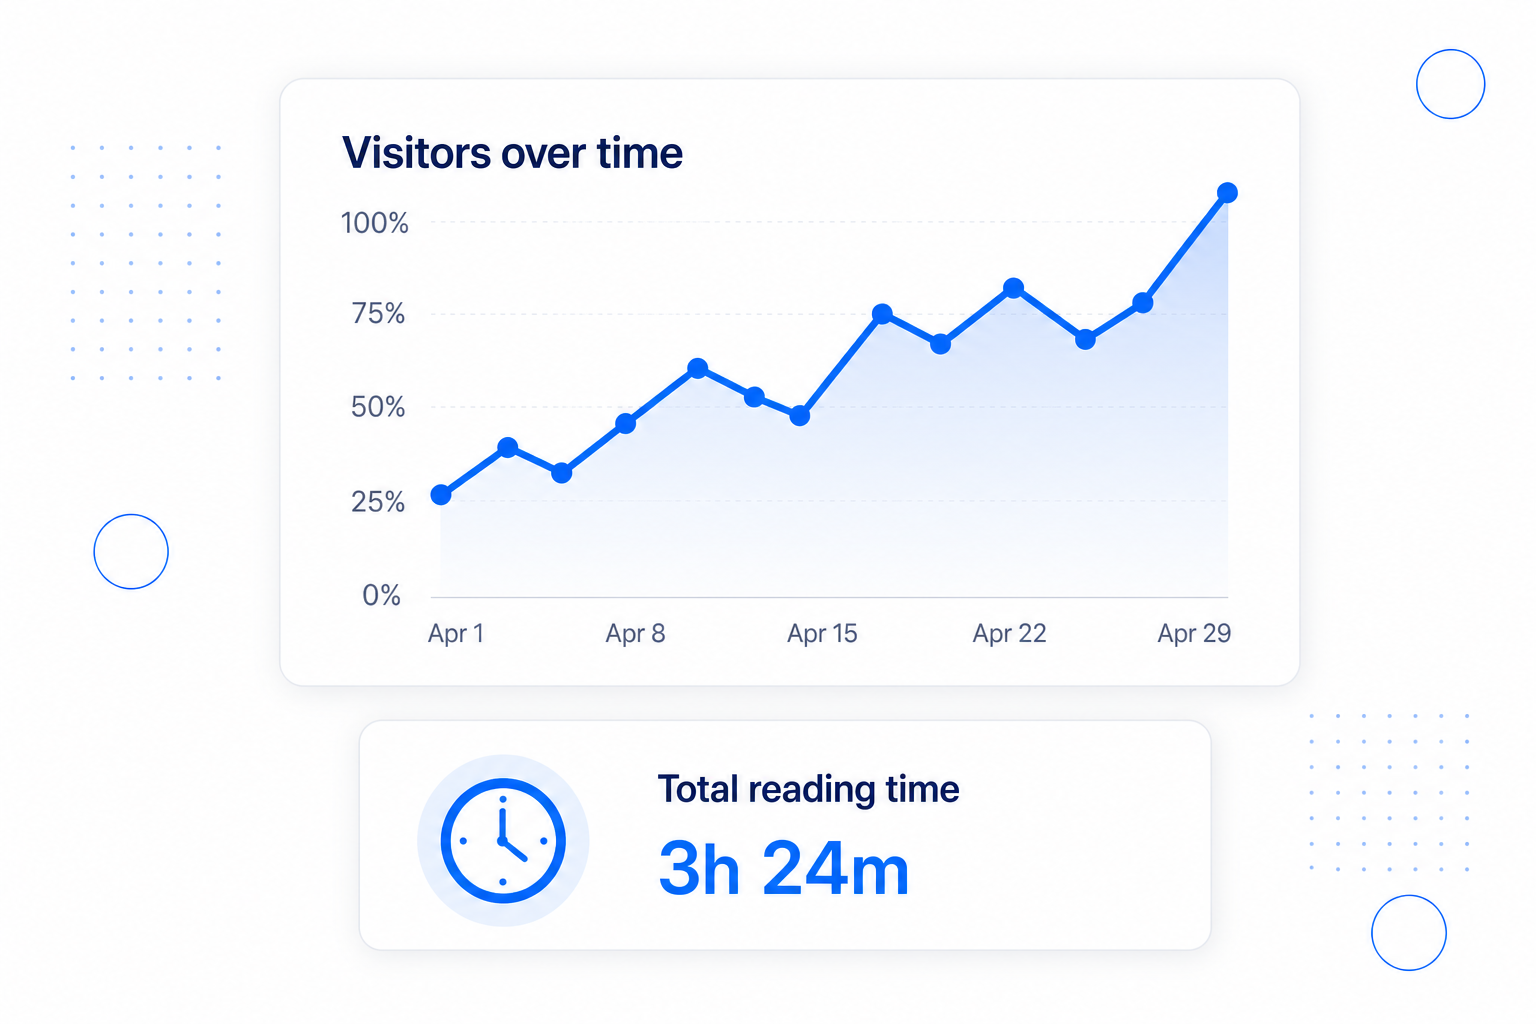
Time is the truest signal of interest. Alongside visitor counts, every flipbook tracks total reading time and visitors over time, so you can see whether a campaign, email or social post is actually pulling engaged readers.

  • Watch visitors over time to see which promotions land.
  • Track total reading time to gauge real engagement.
  • Tie spikes back to the channel or campaign that caused them.
  • Prove the value of your content with hard numbers.
Drop-off chart highlighting the page where most readers stop reading
Drop-off

Find exactly where readers leave

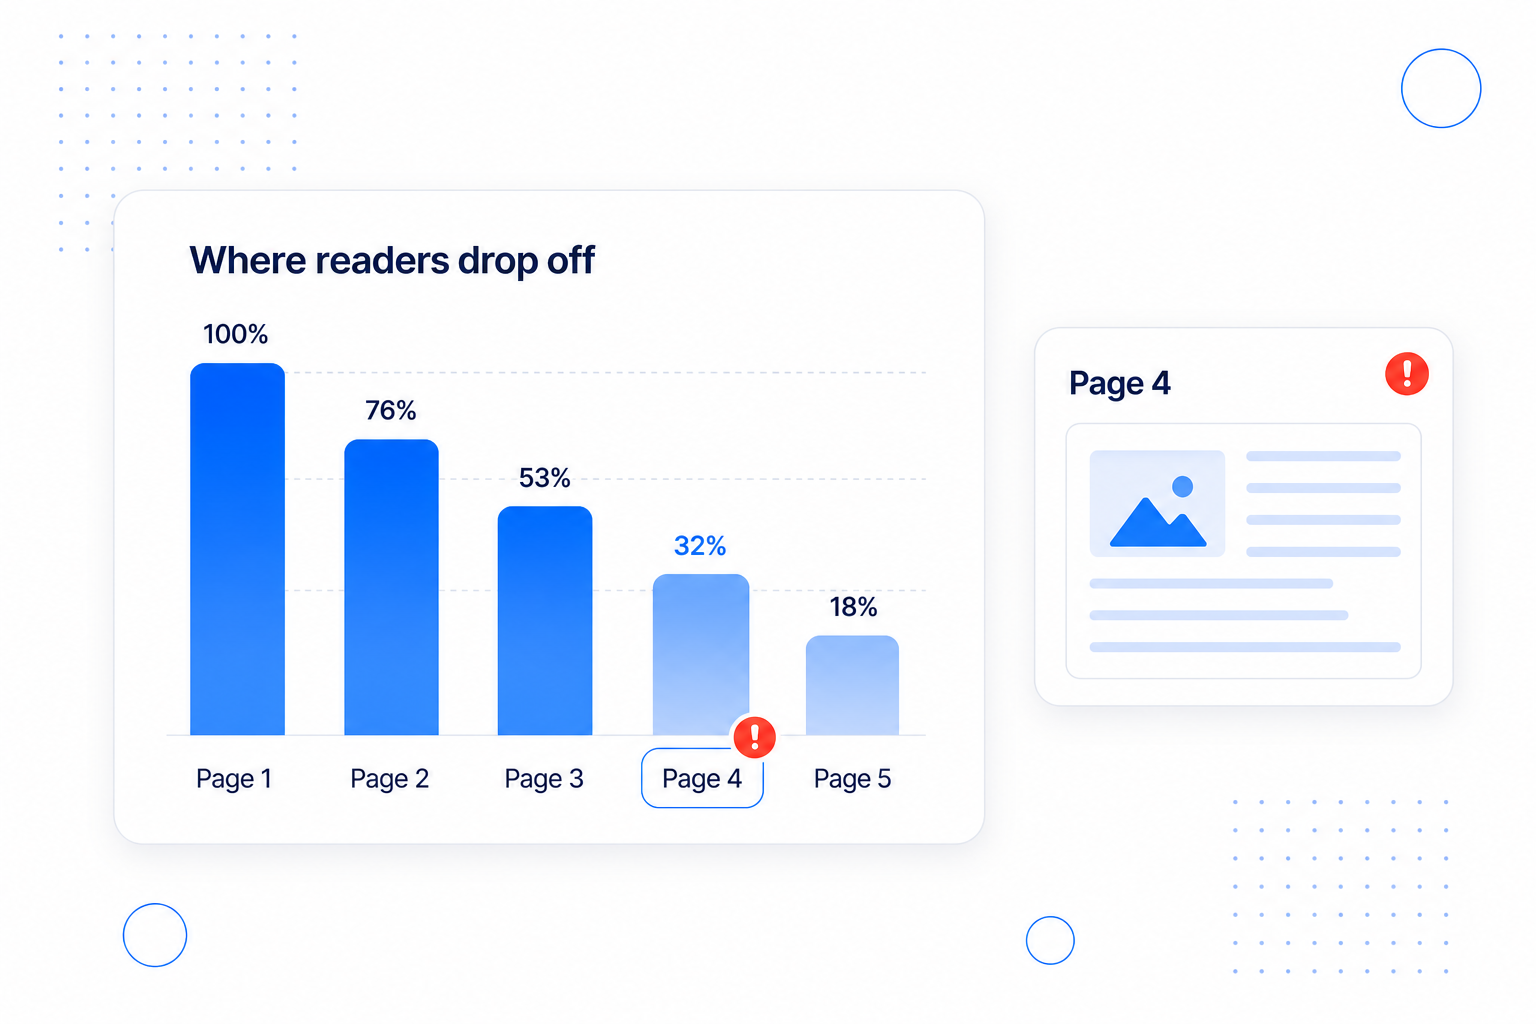
Most flipbooks lose readers at one or two specific pages - a slow intro, a dense spread, a weak call to action. The drop-off rate per page points straight to the problem so you can fix the right thing instead of rewriting everything.

  • Spot the page with the highest drop-off at a glance.
  • Diagnose why: too long, too early an ask, or a dull spread.
  • Move your key message before the drop-off point.
  • Re-check after changes to confirm the leak is fixed.
Update Flipbook PDF screen replacing the file while keeping existing settings and links
Update & Improve

Improve and re-publish in one click

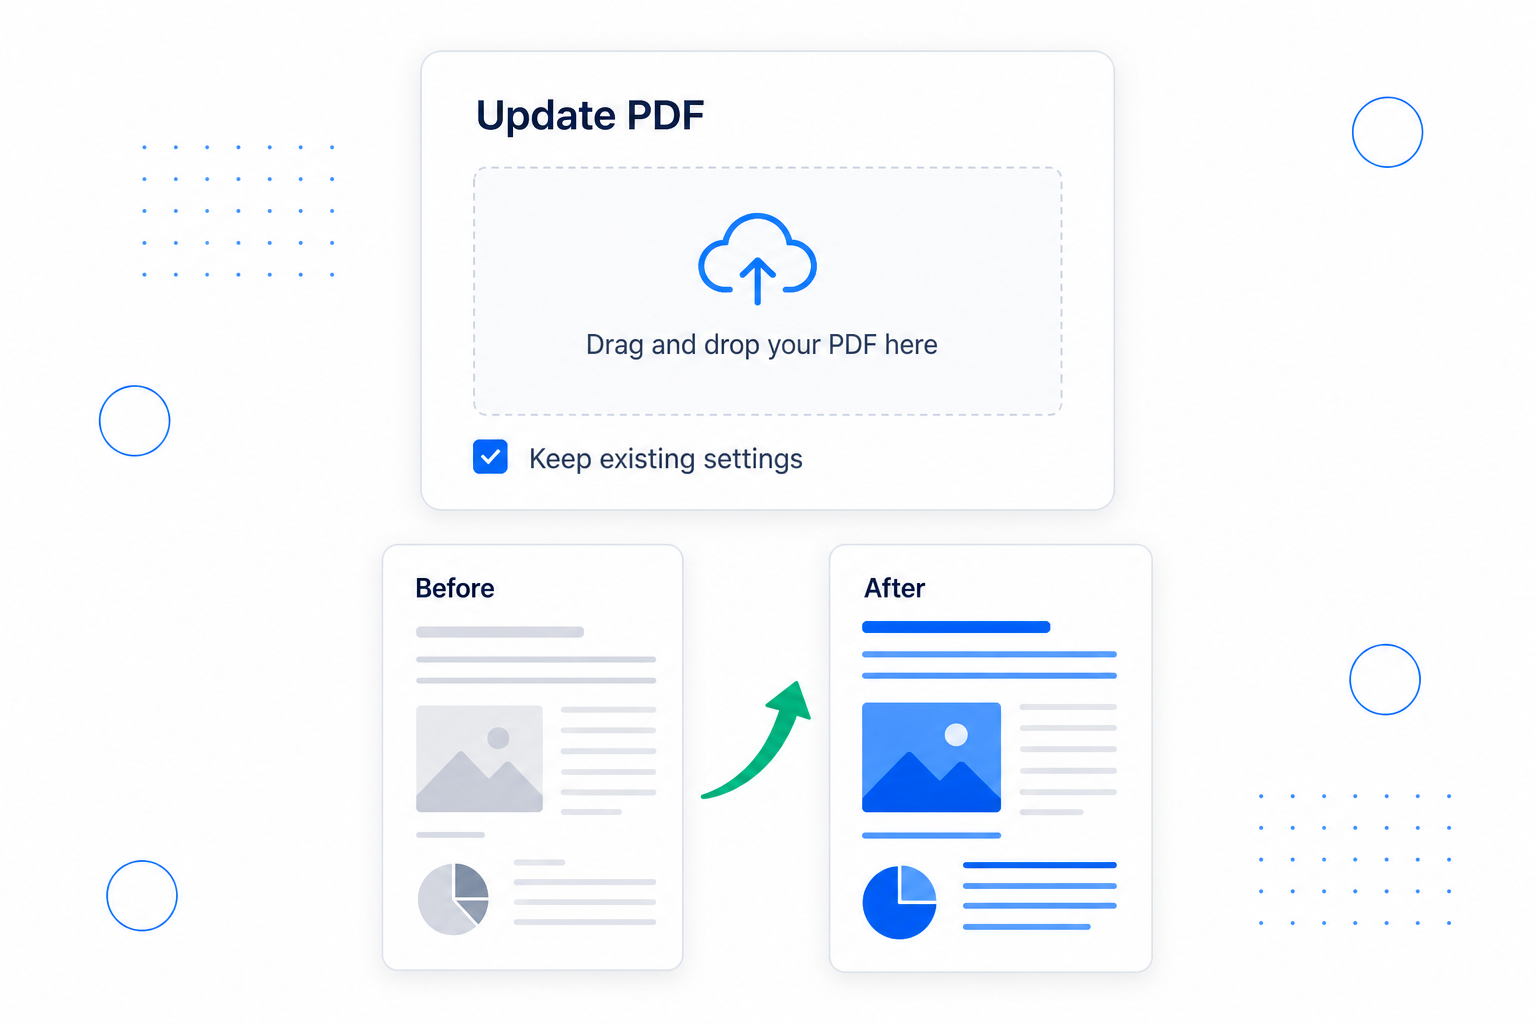
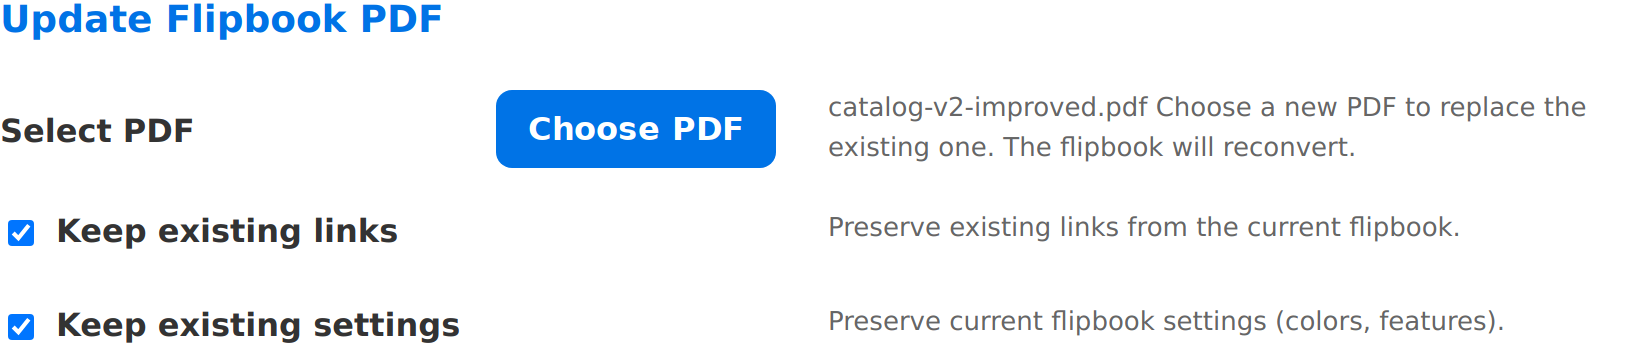
Insights are only useful if you act on them. When you have improved your content, swap the PDF straight into the same flipbook - your share link and embed stay exactly the same, so everywhere you posted it instantly shows the better version.

  • Upload a revised PDF to replace the existing one.
  • Keep your existing settings and links - no re-embedding.
  • Your live URL updates everywhere automatically.
  • Measure again to see your changes pay off.

How to read your stats and act on them

You can go from "I published a flipbook" to "I know exactly what to fix" in a few minutes. Here is the whole flow: open your statistics, read the overview, find the drop-off, then re-publish an improved version.

1

Open your flipbook's statistics

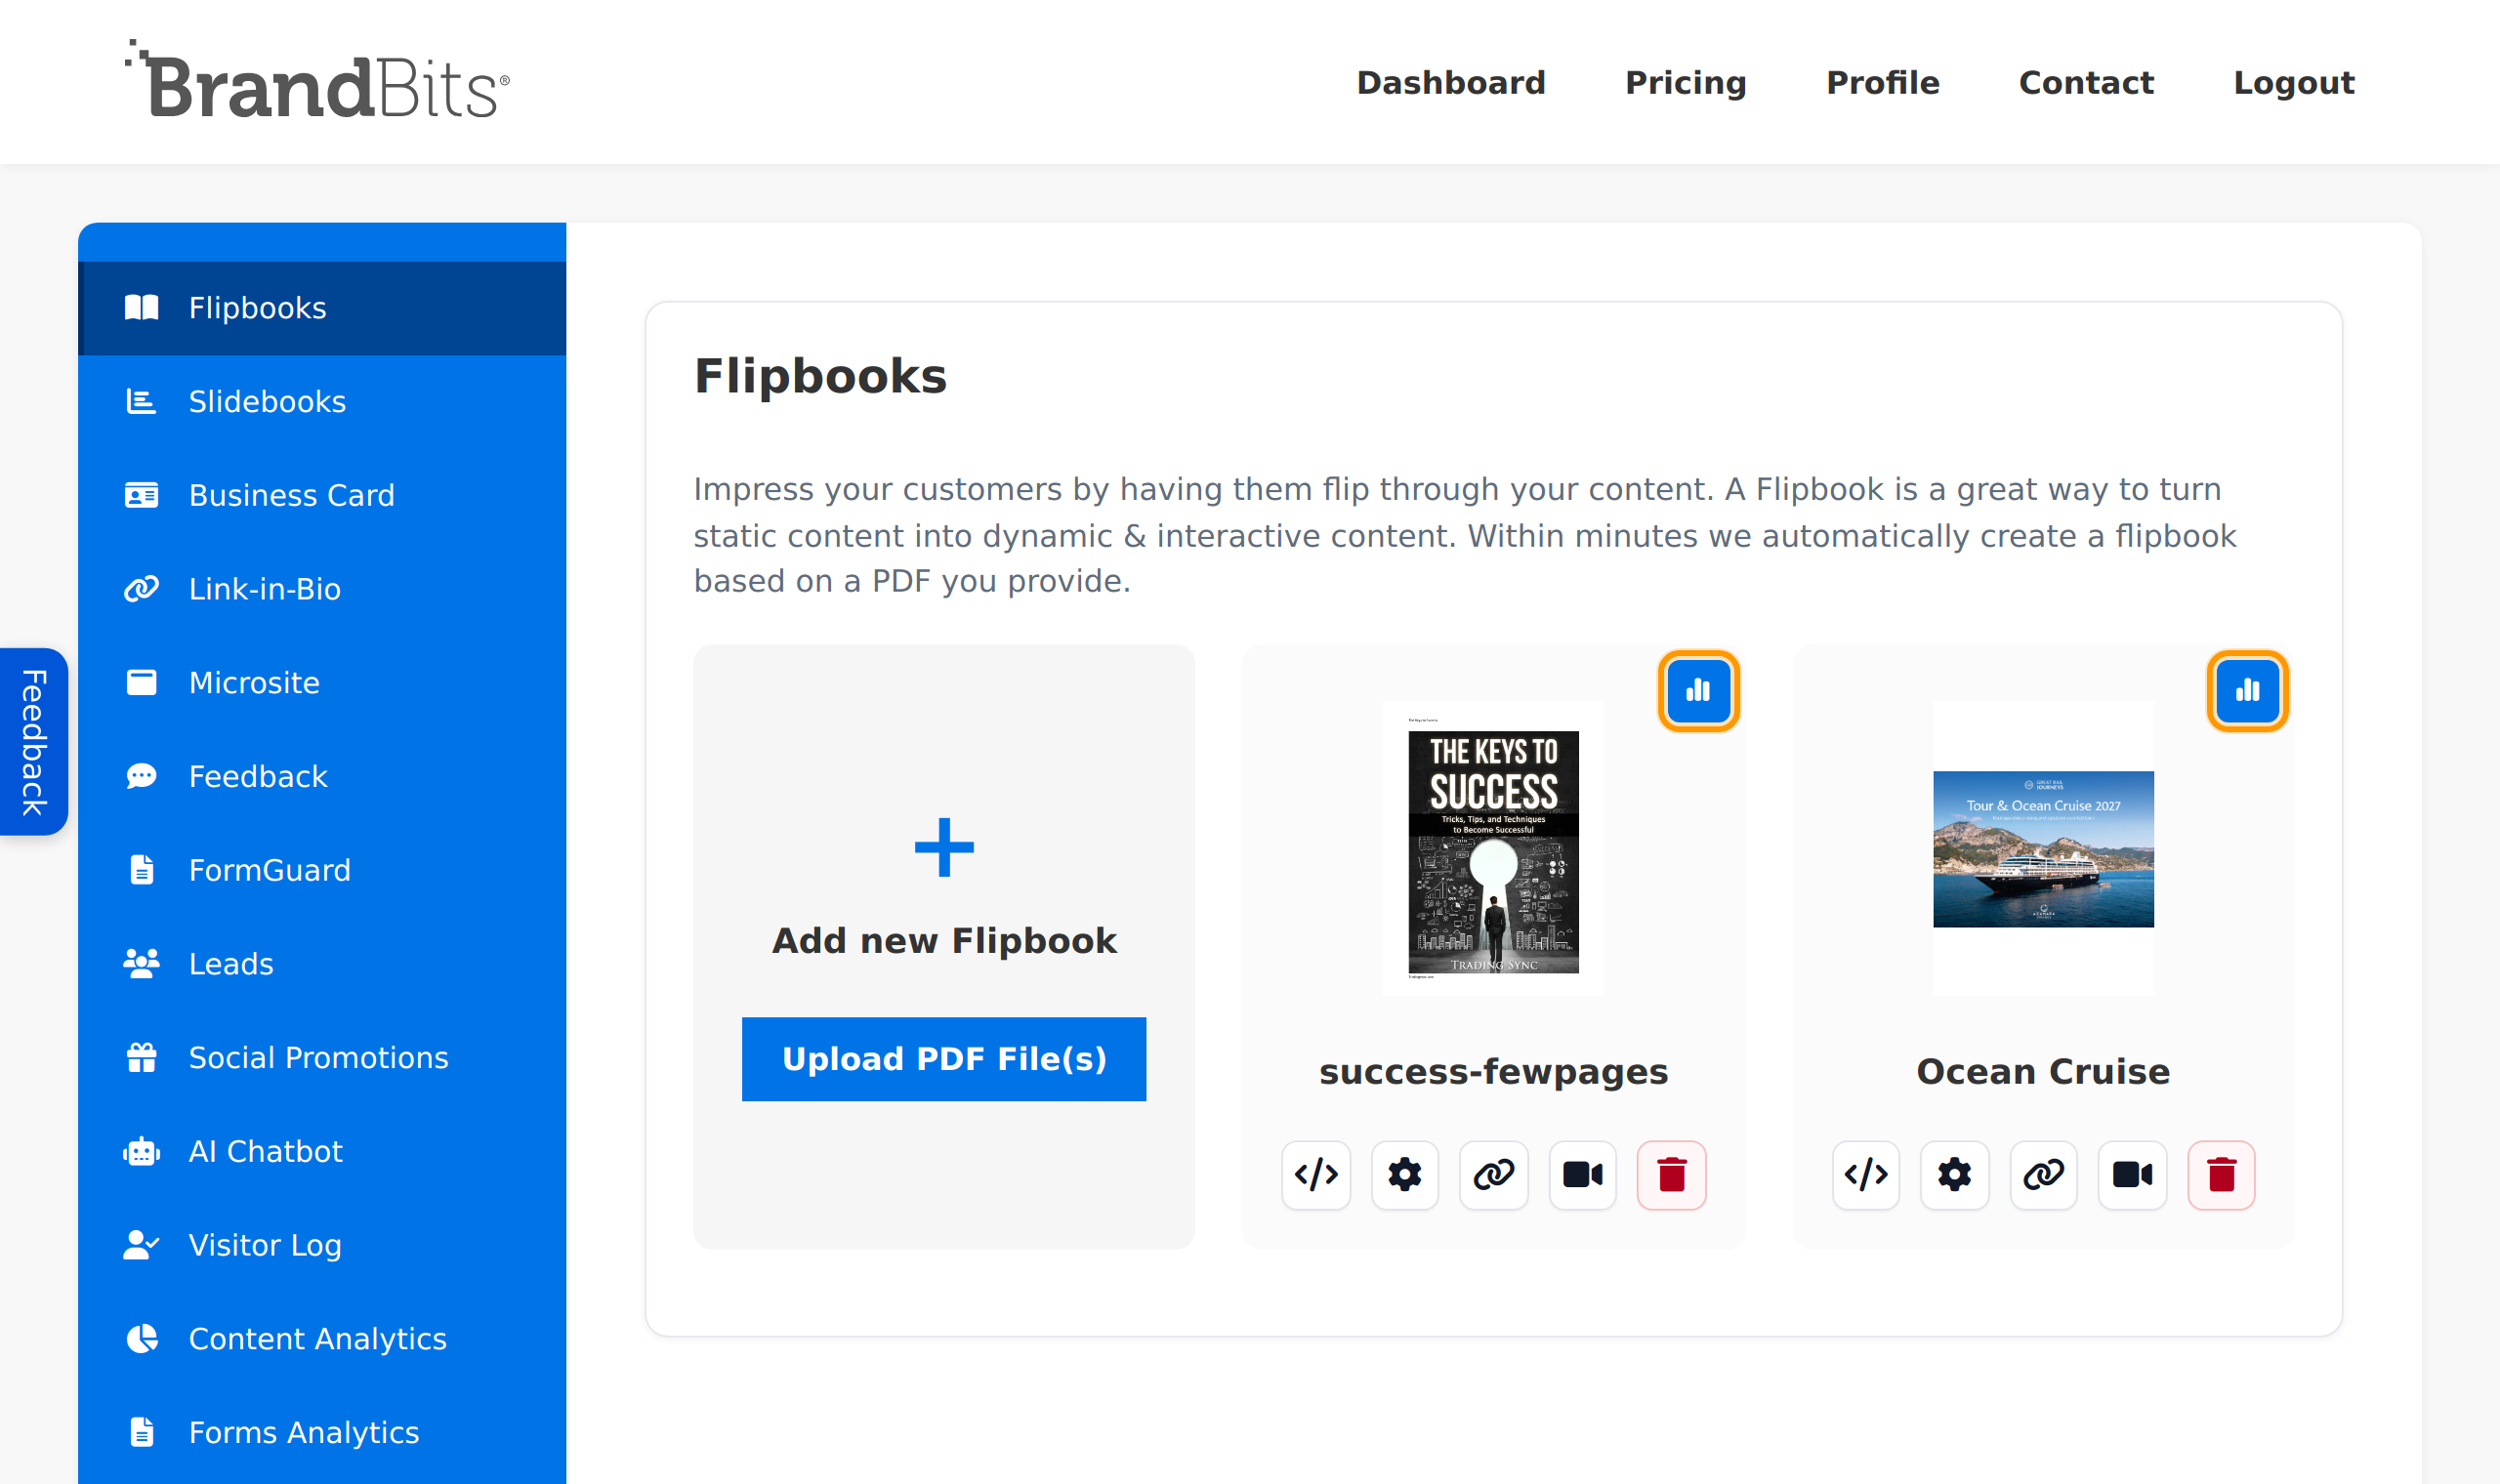
In the sidebar, open Flipbooks. On the flipbook you want to analyse, click the Statistics (chart) button. Every flipbook tracks its own stats automatically - there is nothing to set up.

  • Stats update continuously, so check back any time after publishing.
  • Use the timeframe buttons - 7 days, 30 days, 90 days or All time - to widen or narrow the window.
Flipbooks screen with the Statistics button on each flipbook
Click the Statistics button on any flipbook to open its analytics.
2

Read the overview

The top of the report shows your headline numbers: Total visitors and Total reading time, plus a visitors over time chart. This is your quick health check.

  • Use visitors over time to see which campaigns or posts drove traffic.
  • Compare reading time to visitors - high visits but low reading time means the content isn't landing.
Flipbook stats overview showing total visitors, reading time and a visitors-over-time chart
The overview: total visitors, total reading time and visitors over time.
3

Find your drop-off page

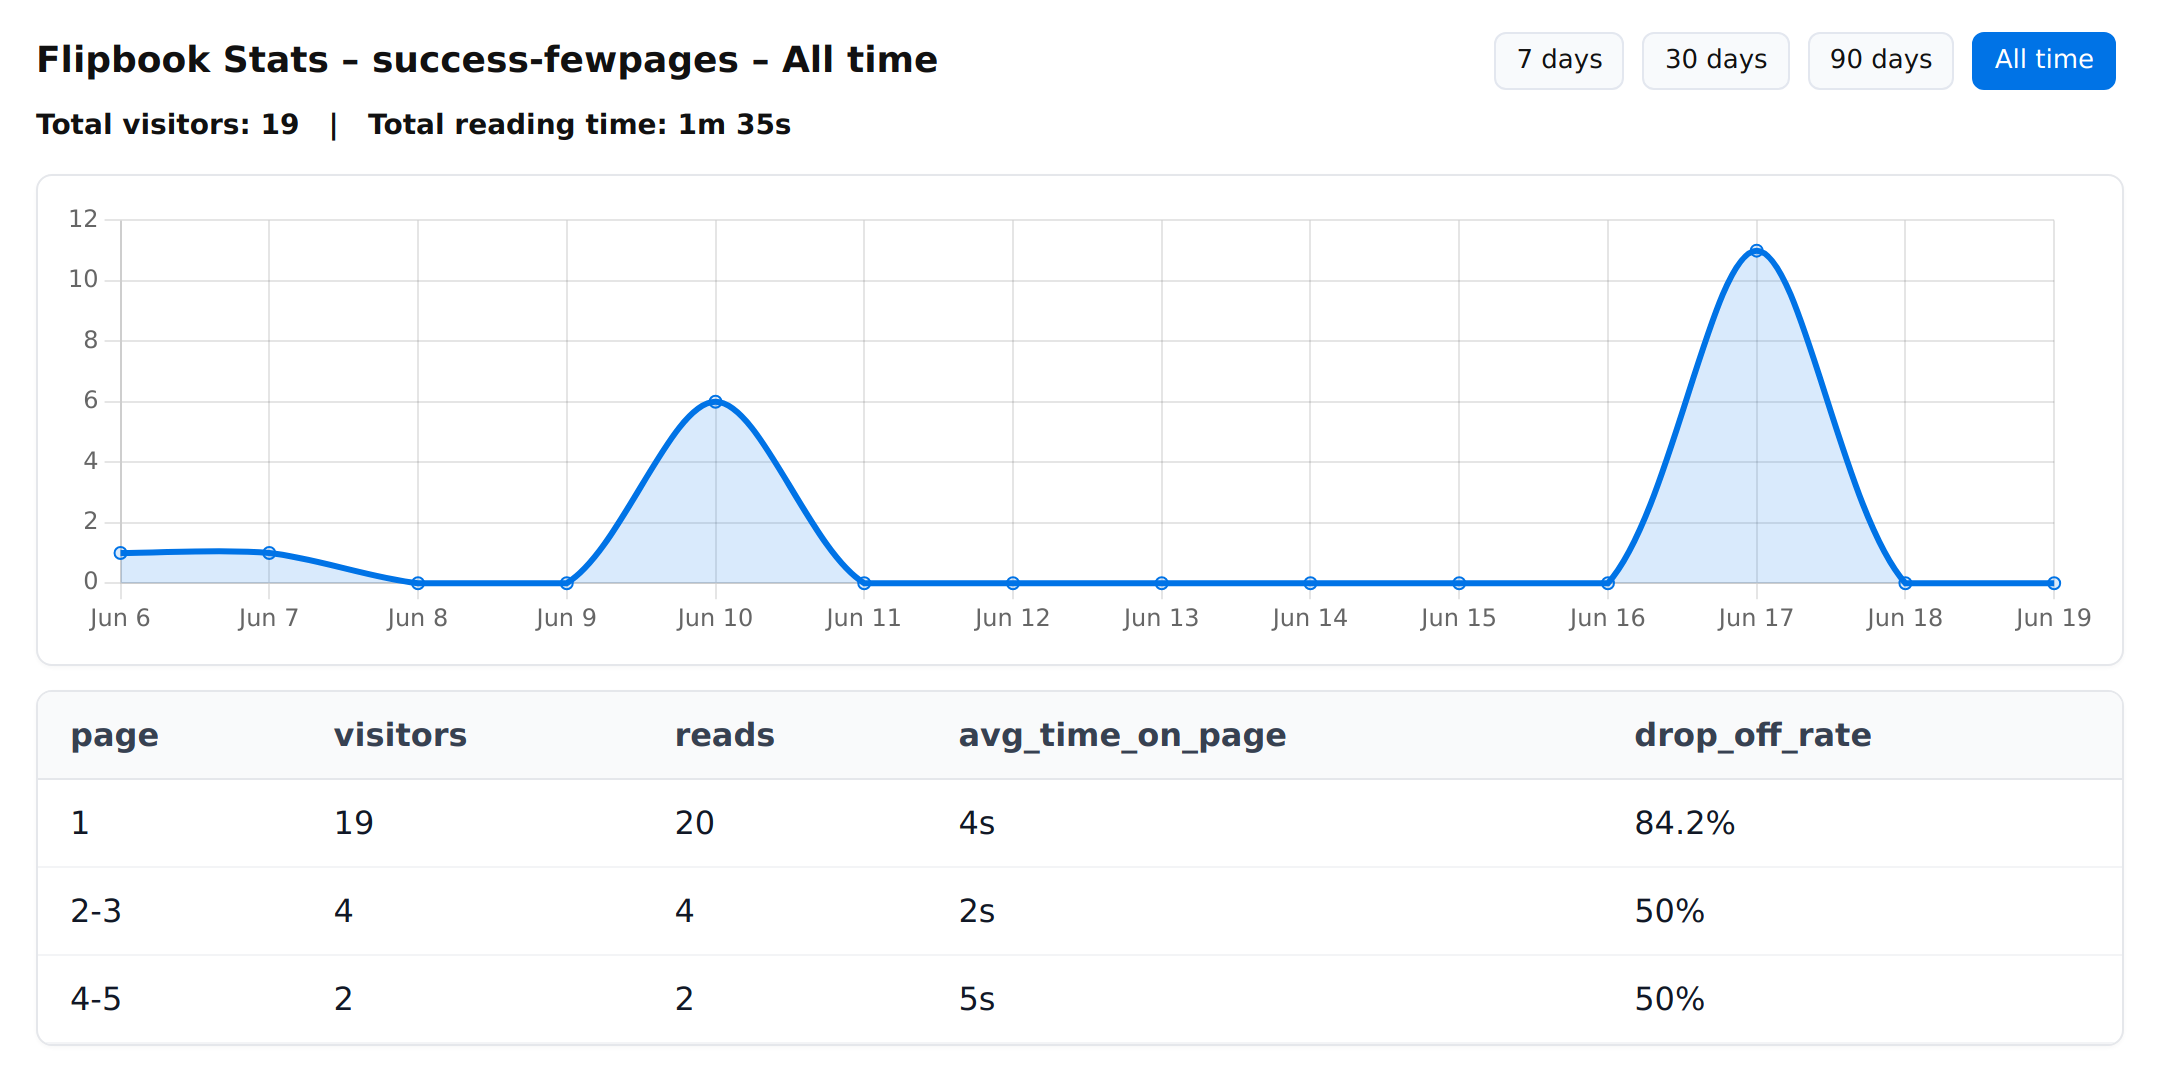
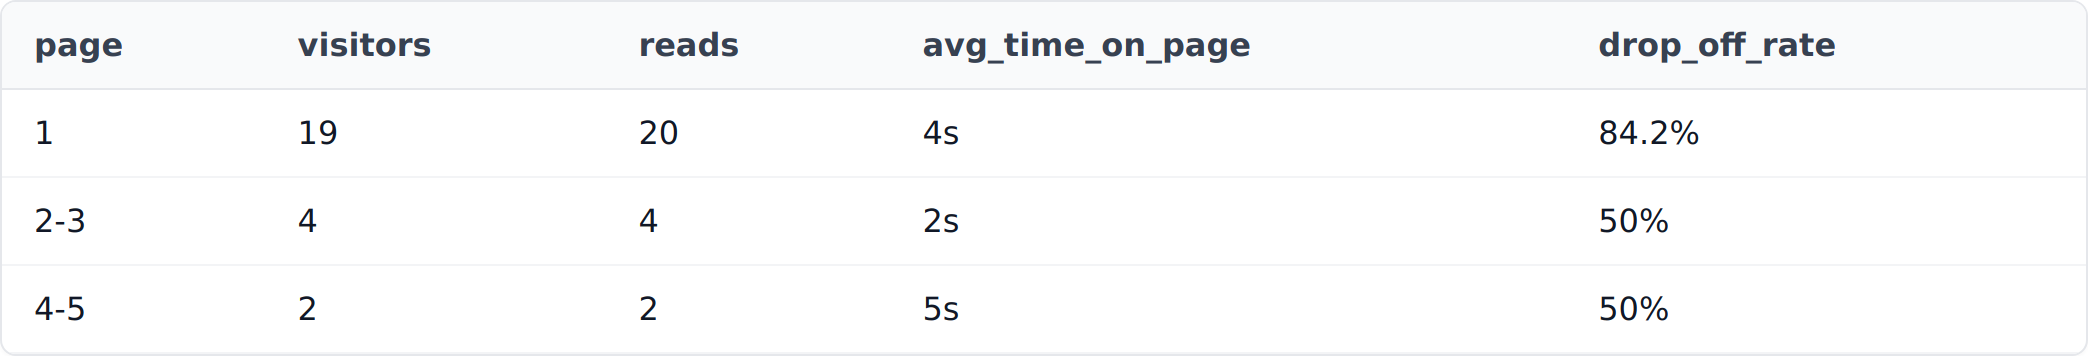
Scroll to the per-page table. Each row shows that page's visitors, reads, average time on page and drop-off rate. This is where the real story is.

  • Find the page with the highest drop-off rate - that is where you are losing readers.
  • Note your highest average time pages - that content is working, so do more of it.
  • If drop-off spikes early, your intro is too slow or you asked for something too soon.
Per-page statistics table with visitors, reads, average time and drop-off rate
The per-page table - sort out where attention peaks and where readers leave.
4

Improve the content and re-publish

Make your edits in the original document - tighten the slow pages, move your strongest message before the drop-off point - then push the new version live without losing your link. On the flipbook's Settings page, scroll to Update Flipbook PDF.

  • Under Select PDF, click Choose PDF and pick your improved file.
  • Leave Keep existing settings (and links) ticked so nothing else changes.
  • Click Save & Update - your existing share link and embeds now show the new version everywhere.
  • Come back to the statistics in a few days to confirm the drop-off improved.
Update Flipbook PDF section in flipbook settings with Keep existing settings option
"Update Flipbook PDF" - swap in the improved file and keep your existing link.

Putting it together

Publish your flipbook, watch the page-by-page statistics to see what readers actually do, fix the page that loses them, then re-publish the improved version straight to the same link. Repeat, and every flipbook you make gets a little better at holding attention and driving action.

That measure-improve-repeat loop is built into BrandBits, and we keep adding tools over time based on customer feedback to make it even more valuable for you.

Turn Your Flipbooks Into Better Content

Try every tool free.

Start for Free
No credit card required · Go live in minutes